YUI 2: ProfilerViewer Control
YUI 2: ProfilerViewer Control
YUI's Profiler is a headless system for generating profiling data about the JavaScript functions that comprise your web application. The ProfilerViewer Control detailed here is used in combination with Profiler to provide rich visualizations of your profiling data — both graphically (using the Charts Control) and in tabular format (using DataTable).
Note: Be sure to reference the Profiler User's Guide for full information about collecting profiling data. ProfilerViewer is merely a window into the data that Profiler collects on your behalf.
On This Page:
Quick Links:
- Examples: Explore examples of the ProfilerViewer Control in action.
- API Documentation: View the full API documentation for the ProfilerViewer Control.
- Release Notes: Detailed change log for the ProfilerViewer Control.
- License: The YUI Library is issued under a BSD license.
- Download: Download the ProfilerViewer Control as part of the full YUI Library at YUILibrary.com.
Getting Started
The ProfilerViewer Control uses the YUI Loader (which includes the Yahoo Global Object), Event Utility, Dom Collection, Element Utility, and Profiler. It will make minor cosmetic use of Drag and Drop, if present. When the ProfilerViewer console is rendered, it pulls in the DataTable Control and (if enabled) the Charts Control; these latter dependencies do not need to be on the page in advance, and it's best to let ProfilerViewer bring them in unless you're using them on the page already.
<!-- Dependencies -->
<script src="http://yui.yahooapis.com/2.9.0/build/yuiloader/yuiloader-min.js" ></script>
<script src="http://yui.yahooapis.com/2.9.0/build/dom/dom-min.js" ></script>
<script src="http://yui.yahooapis.com/2.9.0/build/event/event-min.js" ></script>
<script src="http://yui.yahooapis.com/2.9.0/build/element/element-min.js" ></script>
<script src="http://yui.yahooapis.com/2.9.0/build/profiler/profiler-min.js" ></script>

<!-- Minor optional dependency -->
<script src="http://yui.yahooapis.com/2.9.0/build/dragdrop/dragdrop-min.js" ></script>
yui-skin-sam class name to an element that is a parent of the element
in which the ProfilerViewer Control lives. You can usually accomplish this simply by putting the class on the
<body> tag:
<body class="yui-skin-sam">
For more information on skinning YUI components and making use of default skins, see our Understanding YUI Skins article here on the website.

YUI Dependency Configurator:
Instead of copying and pasting the filepaths above, try letting the YUI dependency Configurator determine the optimal file list for your desired components; the Configurator uses YUI Loader to write out the full HTML for including the precise files you need for your implementation.
Note: If you wish to include this component via the YUI Loader, its module name is profilerviewer. (Click here for the full list of module names for YUI Loader.)
Where these files come from: The files included using the text above will be served from Yahoo! servers. JavaScript files are minified, meaning that comments and white space have been removed to make them more efficient to download. To use the full, commented versions or the -debug versions of YUI JavaScript files, please download the library distribution and host the files on your own server.
Order matters: As is the case generally with JavaScript and CSS, order matters; these files should be included in the order specified above. If you include files in the wrong order, errors may result.
With the Profiler and the ProfilerViewer Control loaded on the page, you can begin profiling your code and exploring the profiling data visually. After you've configured Profiler (see its User's Guide for more on how to use Profiler to profile objects, functions and constructors), you can instantiate ProfilerViewer with the following two (optional) arguments:
- Target Element: A string element ID or object element reference for the DOM element into which your ProfilerViewer console should be rendered. If you omit or pass a value a value of
nullor""for this argument, ProfilerViewer will create a new element as the first child of the document body to house the console. - Options: An optional object containing configuration information for your ProfilerViewer instance; see the Configuring ProfilerViewer section below for the full list of configuraton attributes you can include here.
Setting up ProfilerViewer in a simple use case, given an object myObject that you want to profile, would look like this:
//Tell profiler to profile the object:
YAHOO.tool.Profiler.registerObject("myObject", myObject);

var pv = new YAHOO.widget.ProfilerViewer("profilerDiv", {
    base: "/2.9.0/build/" //the base directory for YUI files
                                        //on your server
});
The code above would render a ProfilerViewer console into a div whose ID is profilerDiv, allowing you to explore the performance profile of myObject.
If you use the default settings, ProfilerViewer will load initially in minimized form, showing just a launcher that can be used to reveal the full viewing console. In its initial state, the launcher looks like this:
![]()
At this point, you've put ProfilerViewer's base dependencies on the page. Once the View Profiler Data button is clicked, ProfilerViewer uses YUI Loader to retrieve additional dependencies including:
- The DataSource Utility
- The DataTable Control
- The JSON Utility (optional, for Charts)
- The Charts Control (optional)
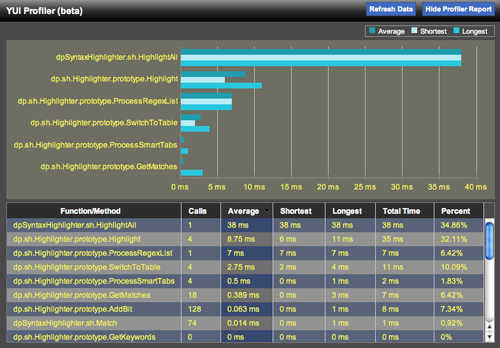
Once YUI Loader has brought in these dependencies, the full ProfilerViewer UI is rendered; if showCharts is set to true (as it is by default), the console looks like this:
Keep in mind that the Profiler, once you load it and specify functions for it to profile, is always running. ProfilerViewer never stops that process. You can continue to interact with the page and exercise the functions that you're profiling; Profiler will continue to track that data, and you can refresh the information in the ProfilerViewer console by clicking the Refresh Data button or by hiding/showing the console.
ProfilerViewer Versus the Firebug Profiler
One question you may ask yourself about the ProfilerViewer is how it differs from the profiler built into Firebug — and why would you use this control, which requires instantiation in your code, rather than Firebug, which can so easily be called up on demand.
The short answer is that YUI's Profiler and ProfilerViewer aren't a replacement for Firebug, and we use Firebug's profiler a lot in our own development. But here are some use cases where it's handy to have another option:
- Browsers other than Firefox: ProfilerViewer can run in all A-grade browsers; because there are wide performance differences between browsers, it's helpful to have some "common ground" in profiling to get a sense of how your app is running in the browsers you care most about.
- Profiling minified code: Firebug's built-in profiler has some difficulties profiling code that has been minified (as by YUI Compressor). In cases where Firebug's profiler is providing unreliable results, YUI Profiler/ProfilerViewer can serve as an alternative.
- Profiling specific objects, functions, and constructors: YUI's Profiler (and the ProfilerViewer) can be focused on specific objects or functions, making it somewhat easier to examine just the parts of your application that you're curious about.
In short, Firebug's profiler is an on-demand workhorse; this alternative is designed to provide an alternative for cross-browser and highly focused code profiling.
Configuring ProfilerViewer
ProfilerViewer is configured via the second argument to its constructor. This optional argument comprises an object containing one or more of the following fields:
| Configuration Option | Purpose |
|---|---|
| base | (string) The base path that YUI Loader should use in bringing YUI components in dynamically. Default: null (YUI Loader will load YUI files as needed from yui.yahooapis.com). |
| chartSeriesDefinitions | (object) If you wish to customize the look and feel of ProfilerViewer's chart instance, you will want to manipulate the chartSeriesDefinitions attribute. Check out the source code for ProfilerViewer for the full default definition and use that as a starting point. (This is not a common attribute to set; it is only relevant if you need to make changes to the visual characteristics of the console's chart.) |
| chartStyle | (obj) A style object passed into the ProfilerViewer's chart instance to set things like font color and background color. As with chartSeriesDefinitions, it is unlikely that you would touch this attribute unless you were re-skinning ProfilerViewer. Check out the source code for ProfilerViewer to review the default content for this property in the event you need to modify it. |
| filter | (function) A function used to filter Profiler data prior to display; see the "Reporting Results" section of the Profiler User's Guide for usage of the filter attribute. A sample filter that would limit ProfilerViewer to displaying data for functions that have been called at least once would look as follows:
function(o) {
   return (o.calls>0);
}
Default: null.
|
| maxChartFunctions | (integer) The maximum number of functions to display in the bar chart at the top of the ProfilerViewer console. Bigger numbers take up more vertical space. Default: 6. |
| swfUrl | (string) The relative or fully qualified path to the YUI Charts Control SWF file. Note that this path is relative to the HTML page being viewed. Default: http://yui.yahooapis.com/2.9.0/build/charts/assets/charts.swf. |
| showChart | (boolean) If false, the YUI Charts component is not employed to visualize profile data; the console in that case consists solely of the DataTable. Default: true. |
| sortedBy | (object) Configuration used to specify how the ProfilerViewer's DataTable instance should be sorted upon first being viewed. Avalable keys for sorting include total, avg, min, max, and pct. Default: {key:"total", dir:"yui-dt-desc"}. |
| tableHeight | (string) Use this attribute to specify an alternative maximum height for the ProfilerViewer's DataTable (be sure to specify both the value and the units; eg, "150px".). Default: 15em. |
| visible | (boolean) If true, the ProfilerViewer will render its full canvas immediately upon instantiation, drawing in DataTable and (if used) Charts. By default, ProfilerViewer will render only a small launcher console at instantiation and will allow you to defer the loading of DataTable and Charts until you've interacted with the page and gathered a baseline of profiling data. This helps reduce the impact that ProfilerViewer's dependencies have on the performance of the code that you're profiling. Default: false. |
There are two ways to use configuration attributes in ProfilerViewer. One is to pass your preferred values in at instantiation:
var pv = new YAHOO.widget.ProfilerViewer(null, {
    //Configuration attribute name/value pairs go here:
    visible: true, //will render the full viewer immediately
                   //upon instantiation
    tableHeight: "300px",
    showChart: false //won't use Charts to display data
});
The other way to use configuration attributes is after instantation, at runtime, using the set method:
var pv = new YAHOO.widget.ProfilerViewer();
pv.set("tableHeight", "25em");
Generally, with ProfilerViewer it's best to set your configuration attributes at instantiation rather than at runtime.
Making Use of ProfilerViewer Events
ProfilerViewer's API includes two events to which you can subscribe:
| Event | Purpose |
|---|---|
| dataRefreshEvent | The dataRefreshEvent fires whenever the refreshData method is called programmatically and whenever the user initiates a data refresh via the UI. Arguments: No data is passed with this event. |
| renderEvent | The renderEvent fires when the ProfilerViewer canvas is first drawn (not the initial launcher, but the full DataTable/Chart canvas). Arguments: No data is passed with this event. |
You can subscribe to ProfilerViewer events as follows:
var pv = new YAHOO.widget.ProfilerViewer();
pv.subscribe("renderEvent", function() {
    YAHOO.log("ProfilerViewer canvas is rendered.");
});
Skinning the ProfilerViewer Console
The ProfilerViewer's presentation is controlled via its Sam Skin CSS file and via JavaScript-based configuration of the Charts Control (if used).
The Skinning Example for ProfilerViewer provides baseline information about the style rules used in the CSS and the style objects used by the Charts Control — and provides the syntax you would use for changing the latter.
YUI on Mobile: Using ProfilerViewer Control with "A-Grade" Mobile Browsers
About this Section: YUI generally works well with mobile browsers that are based on A-Grade browser foundations. For example, Nokia's N-series phones, including the N95, use a browser based on Webkit — the same foundation shared by Apple's Safari browser, which is found on the iPhone. The fundamental challenges in developing for this emerging class of full, A-Grade-derived browsers on handheld devices are:
- Screen size: You have a much smaller canvas;
- Input devices: Mobile devices generally do not have mouse input, and therefore are missing some or all mouse events (like mouseover);
- Processor power: Mobile devices have slower processors that can more easily be saturated by JavaScript and DOM interactions — and processor usage affects things like battery life in ways that don't have analogues in desktop browsers;
- Latency: Most mobile devices have a much higher latency on the network than do terrestrially networked PCs; this can make pages with many script, css or other types of external files load much more slowly.
There are other considerations, many of them device/browser specific (for example, current versions of the iPhone's Safari browser do not support Flash). The goal of these sections on YUI User's Guides is to provide you some preliminary insights about how specific components perform on this emerging class of mobile devices. Although we have not done exhaustive testing, and although these browsers are revving quickly and present a moving target, our goal is to provide some early, provisional advice to help you get started as you contemplate how your YUI-based application will render in the mobile world.
More Information:
- Challenges of Interface Design for Mobile Devices - YUI Blog article by Lucas Pettinati, Yahoo! Sr. Interaction Designer.
- Performance Research, Part 5: iPhone Cacheability - Making it Stick - YUI Blog article by Tenni Theurer and Wayne Shea from the Yahoo! Exceptional Performance Team
The ProfilerViewer Control can be used with mobile devices, but there are caveats:
- iPhone does not support Flash: The YUI Charts Control is a hybrid JavaScript/Flash component; it's not supported on iPhone. Set
showCharttofalsewhen using ProfilerViewer on the iPhone. - Defer loading of ProfilerViewer UI as long as possible: The ProfilerViewer uses the YUI DataTable Control to visualize the profiling data. On iPhone, you can expect the richness of DataTable to bog down the slow processor more than you'd see on a desktop PC. As a result, it makes sense to interact with your script and gather profiling data prior to activating your ProfilerViewer interface — that will help you get more accurate information about your application.
Support & Community
The YUI Library and related topics are discussed on the on the YUILibrary.com forums.
Also be sure to check out YUIBlog for updates and articles about the YUI Library written by the library's developers.
Filing Bugs & Feature Requests
The YUI Library's public bug tracking and feature request repositories are located on the YUILibrary.com site. Before filing new feature requests or bug reports, please review our reporting guidelines.
ProfilerViewer Control Examples:
YUI ProfilerViewer Control on del.icio.us:
be the first to bookmark this page!
All YUI 2.x users should review the YUI 2.8.2 security bulletin, which discusses a vulnerability present in YUI 2.4.0-2.8.1.
- YUI Library
- YUI Home
- YUI 3
- YUIBlog
- Bug Reports/Feature Requests
- YUI on GitHub
- YUI License
- YUI 2.x Resources
- YUI 2 Archives
- YUI 2 Examples
- YUI 2 API Docs
- YUI 2 Discussion Forums

- YUI Components
- Animation
- AutoComplete
- Browser History Manager
- Button
- Calendar
- Carousel
- Charts
- Color Picker
- Connection Manager
- Container
- Cookie
- DataSource
- DataTable
- Dom
- Drag & Drop
- Element
- Event
- Get
- ImageCropper
- ImageLoader
- JSON
- Layout Manager
- Logger
- Menu
- Paginator
- Profiler
- ProfilerViewer
- ProgressBar
- Resize
- Rich Text Editor
- Selector
- Slider
- Storage
- StyleSheet
- SWF
- SWFStore
- TabView
- TreeView
- Uploader
- Yahoo Global Object
- YUI Loader
- YUI Test
- Reset CSS
- Base CSS
- Fonts CSS
- Grids CSS
Copyright © 2013 Yahoo! Inc. All rights reserved.